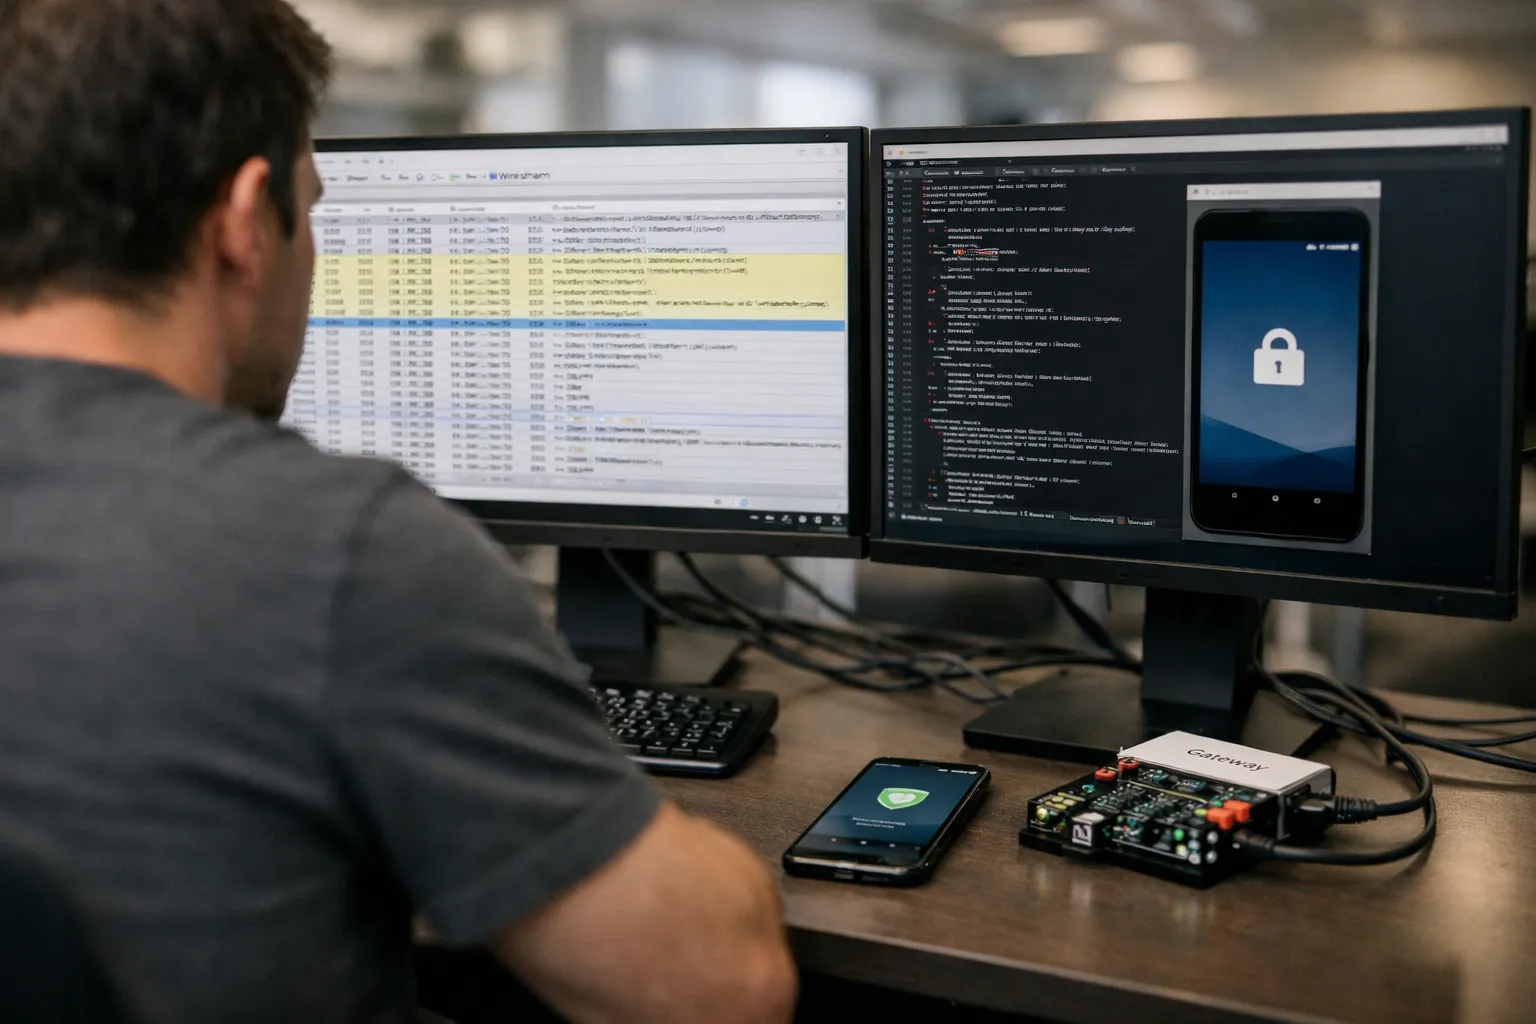
Independent verification of a VPN client’s privacy claims is now a core skill for anyone who cares about what their VPN actually collects and sends. This step‑by‑step guide walks through a reproducible lab methodology to audit VPN clients on Windows and Android in 2026. It focuses on practical tests you can run at home or in a controlled lab to detect telemetry, persistent identifiers, DNS/IPv6 leaks, TLS endpoints, and unexpected network behaviour.
Why this matters in 2026
Many VPN vendors publish privacy policies and “no‑logs” claims, while modern clients ship with telemetry, crash reporters, and third‑party CDNs. Independent, reproducible audits let you check whether a client’s behavior matches its claims. As of 2026, audits and transparency reports are more common, but automated telemetry and new backend architectures (CDN fronting, cloud functions) make network‑level verification essential.
Overview of the methodology
This guide uses a layered approach: controlled lab environment, static inspection, dynamic runtime hooks, network capture and analysis, certificate and endpoint verification, and a reproducible reporting workflow.
- Build an isolated test lab (VMs, virtual networks, instrumented Wi‑Fi)
- Perform static analysis of the client binary/package
- Run dynamic analysis with instrumentation (Frida/Objection) and UI tracing
- Capture and analyze network traffic (pcap, TLS certs, DNS, QUIC)
- Test privacy features (kill switch, split tunnel, persistent IDs)
- Produce a reproducible report with artifacts and independent checks
Test lab: hardware and baseline setup
Goal: isolate the client so all outgoing traffic is observable and reproducible.
- Host machine: workstation with Linux (Ubuntu 24.04/26.04 recommended) for tooling and orchestration.
- VMs: Windows 11 VM (Hyper‑V/VirtualBox) and Android emulator (Android 13+ or a rooted emulator image) to run official clients. Use snapshots.
- Instrumented gateway: a small Linux box or Raspberry Pi configured as a transparent network gateway to capture traffic (tcpdump/tshark, mitmproxy for TLS interception where possible).
- Isolated network: put VMs on an isolated virtual network with the gateway as default route so all traffic flows through the capture point.
- Time syncing: ensure all machines use the same NTP source to correlate logs and captures.
Quick capture commands
- Start a full capture on the gateway:
sudo tshark -i eth0 -w vpn_test_001.pcapng - Filter live:
tshark -i eth0 -f "host 0.0.0.0/0" -Y "ip or ip6" - Extract DNS transactions:
tshark -r vpn_test_001.pcapng -Y dns -T fields -e dns.qry.name
Static analysis
Before running the client, inspect binaries and packages to find hard‑coded domains, analytics libraries, or certificates.
- Android APK: use
apktoolto unpack and grep for hosts, keys, and third‑party SDKs:apktool d app.apk. - Windows installer: extract resources with 7‑Zip or use strings and PE inspectors (PEStudio, Exeinfo) to search for domains and telemetry function names.
- Search for known analytics SDKs: names like "sentry", "datasync", "segment", or "telemetry" in resources/config files.
- Check manifest/config: Does the client ship with crash reporting endpoints or a telemetry toggle in config files?
Dynamic analysis: instrumentation and runtime visibility
Static checks miss runtime behavior like TLS pinning or runtime‑loaded modules. Use dynamic tools to observe and, where allowed, intercept.
Android
- Use an emulator or a rooted device. Install Frida server on the device (
./frida-server && adb forward tcp:27042 tcp:27042). - Run
frida-trace -U -f com.vendor.vpn -i "send*" -I "recv*"to trace network APIs. - Objection can bypass some checks:
objection --gadget com.vendor.vpn explorethen inspect files and preferences to find persisted IDs. - Where TLS pinning interferes with mitmproxy, use Frida scripts to hook javax.net.ssl methods or use tools like JustTrustMe (responsibly, in your lab) to disable pinning for analysis.
Windows
- Use Procmon and Sysmon to see file and registry writes. Look for persistent identifiers stored under HKCU or ProgramData immediately after setup.
- Run the client from a snapshot and watch processes with Process Explorer. Inject Frida‑Gadget or use WinPcap/tcpdump to capture traffic.
- To observe TLS sessions, use Wireshark with TLS key logging when possible. Some clients expose environment variables for key logging; otherwise rely on endpoint certificate inspection.
Network analysis: what to capture and why
Comprehensive capture should include packet captures, DNS logs, and TLS certificates. Key goals:
- Identify endpoints the client contacts before and after connecting (app backend, telemetry, CDN).
- Detect leaks: DNS queries going to local resolver, IPv6 traffic outside the tunnel, or direct TCP/UDP to destinations that should be proxied.
- Observe timing and content of telemetry batches: are identifiers sent at install, on connection, or periodically?
Useful tshark filters
- List unique destination hosts:
tshark -r capture.pcapng -q -z hosts,tree - Extract SNI from TLS:
tshark -r capture.pcapng -Y "ssl.handshake.type==1" -T fields -e tls.handshake.extensions_server_name - QUIC flows:
tshark -r capture.pcapng -Y quic -T fields -e quic.connection_id(QUIC often bypasses classic TLS interception).
Telemetry and persistent ID tests
Core privacy checks to run:
- Install the client, create an account if needed, then capture all outbound traffic for the first 30 minutes. Look for IMEI-like strings, MAC addresses, or machine UUIDs sent in payloads.
- Uninstall, reinstall, and reattach captures. Does the app use the same client identifier across installs? If yes, where is it persisted?
- Create accounts from different IPs or devices and see if backend associates them (requires coordinated testing or an account test pool).
- Toggle telemetry opt‑out (if provided) and observe traffic differences. Some vendors implement client toggles only for local UI behavior; verify server‑side suppression.
Certificate & endpoint verification
Map the IP ranges and TLS certificates the client uses:
- For each TLS endpoint, fetch the certificate:
openssl s_client -connect host:port -servername host -showcerts. Check issuer and whether certs are public CA issued or self‑signed. - Reverse DNS and whois lookups help identify whether endpoints belong to CDN providers or vendor infrastructure.
- Watch for "handshake splitting" where the control plane goes to vendor backend and data plane to ephemeral exits—this is common but should be documented by the vendor.
Leak tests and feature validation
Verify advertised features actually work:
- Kill switch: force‑kill the client process or unplug the tunnel and confirm no traffic leaks (use ping to known IPs and monitor pcap for outbound flows).
- Split tunneling: configure per‑app or per‑destination rules and test that excluded apps use the normal route and included apps use the tunnel.
- IPv6: disable IPv6 on gateway then enable to verify whether client handles IPv6 properly (IPv6 leaks remain frequent).
Reproducible reporting and responsible disclosure
Build a report that others can reproduce and that a vendor can act on:
- Include environment details: OS versions, emulator/device image hashes, client version number, and exact command lines used to capture.
- Attach pcap excerpts and filtered transcripts rather than raw, unfiltered captures where privacy of test accounts is concerned.
- Provide clear reproduction steps for each finding, with timestamps and packet offsets within pcaps.
- If you discover sensitive leaks (PII, credentials), follow responsible disclosure: contact the vendor privately, allow remediation time, and coordinate any public disclosure.
Checklist: minimum checks for every audit
- Baseline capture (no VPN) and capture while VPN connected
- List of all outbound hosts/IPs, with reverse DNS and whois
- Evidence of telemetry payloads and any persistent identifiers
- TLS certificate provenance for backend endpoints
- Kill switch and IPv6 leak test results
- Reinstall/resnapshot tests for identifier persistence
- Replayable commands and artifacts for third‑party verification
Limitations and caveats
There are practical limits to what a single auditor can determine:
- Encrypted or proprietary protocols (e.g., QUIC with encryption) limit payload inspection; endpoint metadata still reveals contact points.
- Server‑side logging cannot be audited from the client side—requests to vendor backends may not reveal retained logs or server processing.
- Legal constraints: in some jurisdictions intercepting or modifying TLS may breach laws—use controlled lab devices and avoid targeting third‑party infrastructure.
Next steps and tools
To deepen audits, consider:
- Automating the workflow with scripts that run installs, captures, and extraction of host lists.
- Integrating binary diffing to detect changes across versions.
- Collaborating with open audit projects and sharing reproducible artifacts for peer verification.
Key tools referenced: tshark/wireshark, mitmproxy, Frida, Objection, apktool, openssl, Procmon/Sysmon, tcpdump, and standard VM snapshots. Keep tooling up to date and refer to each tool’s documentation for the latest usage nuances in 2026.
Conclusion
With a reproducible lab and the steps above, VPN enthusiasts can move beyond trust and into verification. While client‑side inspections cannot show everything that happens server‑side, they reveal much about what a client transmits, whether a telemetry toggle is effective, and how well privacy claims hold up in practice. Publish reproducible findings, engage vendors for fixes, and contribute to a stronger ecosystem where privacy claims are backed by observable evidence.