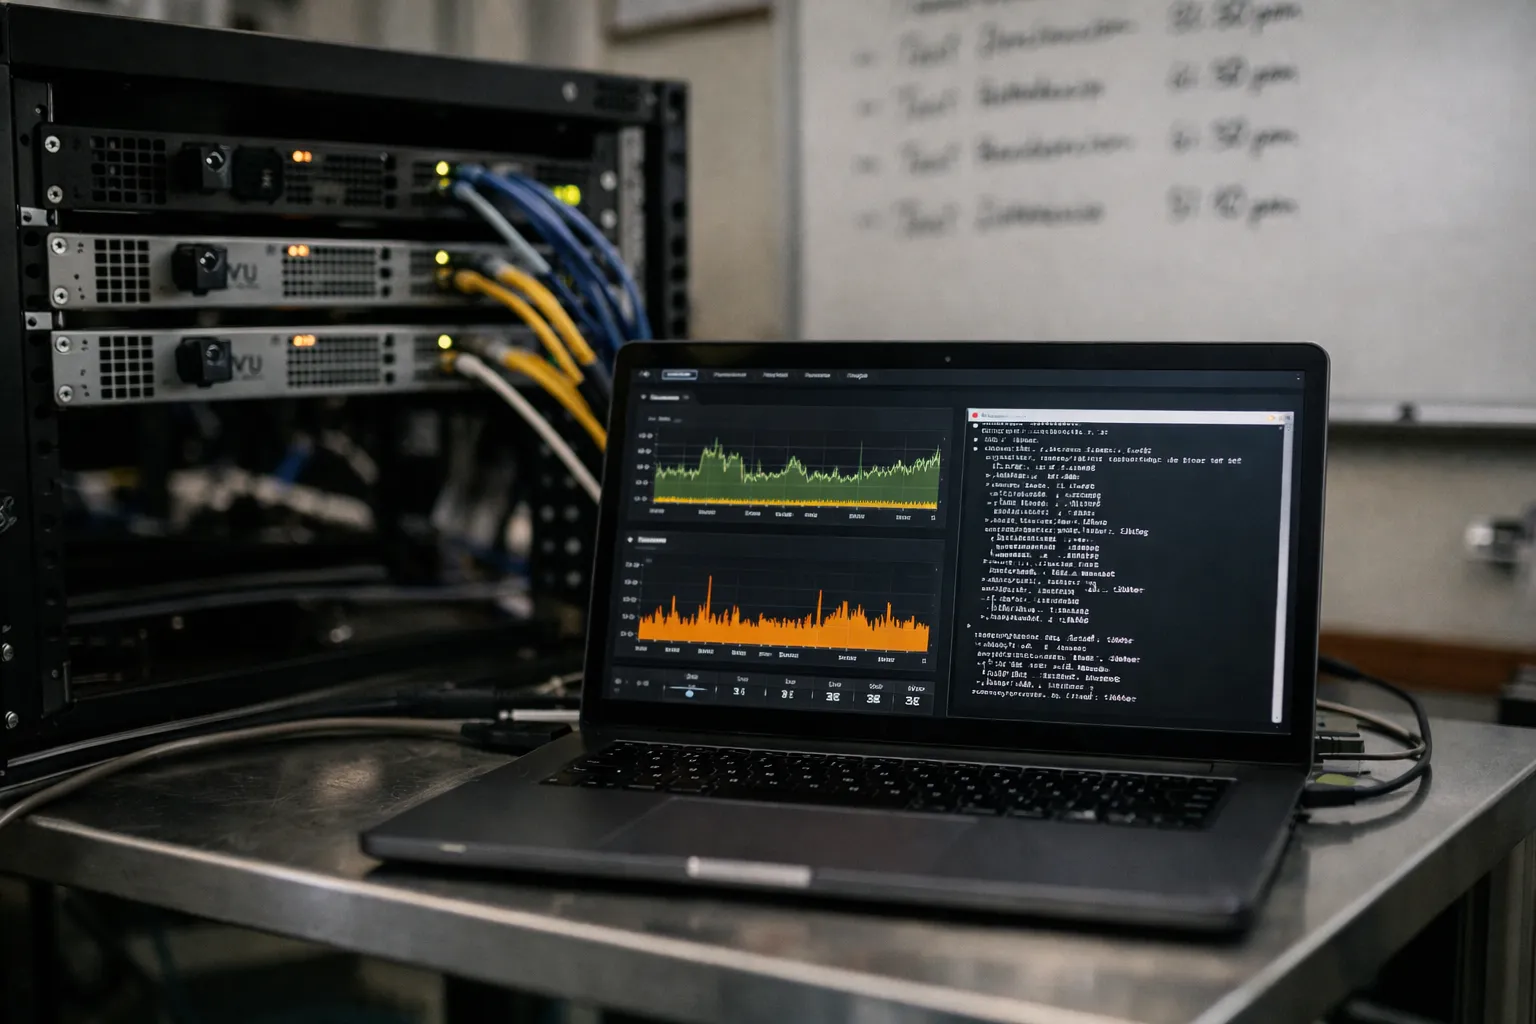
VPN operators and enthusiasts increasingly need reliable, repeatable measurements that show not just raw throughput but real-world privacy behavior. This guide walks through building a reproducible VPN speed and privacy test lab in 2026: the components, controlled test methodology, concrete tooling and example commands, and a simple analysis pipeline you can adapt to your needs.
Why reproducibility matters
Single-run speed tests are misleading: results vary with time-of-day, peering, server load, and client hardware. Privacy checks (DNS, WebRTC, TLS) are just as sensitive to environment and browser state. A reproducible lab lets you isolate variables, compare transports and server locations fairly, and generate evidence you can re-run months later.
Core design goals
- Repeatability: same inputs produce statistically comparable outputs.
- Isolation: minimize local and ISP noise (background apps, NAT behavior).
- Observability: collect detailed metrics (CPU, memory, packets, pcap, DNS queries).
- Automation: tests run scheduled and on-demand with one command.
- Portability: scripts work on cloud instances and local hardware.
What you’ll need (hardware & accounts)
- Test clients: at least two Linux machines (physical or cloud). One "client" that runs the VPN client; one "server" as the VPN exit and measurement host. Use identical CPU classes for repeatability.
- Controller machine: runs orchestration (could be a laptop or CI runner).
- Cloud accounts: 2–4 regions across at least two providers (e.g., aVM on AWS/FaunaCloud and a small VPS on Hetzner) to measure regional differences.
- Time sync: NTP/chrony on all nodes to keep timestamps aligned.
- Storage: central S3-compatible bucket for logs, pcaps and CSVs.
Network topology and isolation
Keep the topology simple: Controller → Client (behind local NAT) → VPN tunnel → Server → Internet. Where possible, reduce intermediate variables:
- Disable background sync apps on clients.
- Use wired connections for clients to avoid Wi‑Fi variance.
- Set deterministic MTU and don’t let OS auto-adjust during measurement.
Test categories and metrics
- Throughput: TCP and UDP bulk throughput (iperf3), multiple parallel streams.
- Latency: ICMP and application latency (ping, h3/QUIC requests).
- Connection setup: time to establish VPN session and first-packet RTT.
- Stability: packet loss and jitter over long runs (10–30 minutes).
- CPU/Memory: measured on both client and server during tests.
- Privacy checks: DNS leaks, WebRTC IP leaks, IPv6 leaks, TLS client fingerprint consistency.
Tooling (recommended, open-source)
- iperf3 — TCP/UDP throughput
- ping and hping3 — latency and ICMP-based testing
- curl / wget — single-request latency and TLS diagnostics
- speedtest-cli or Ookla's CLI — consumer-oriented comparison (note limits)
- tcpdump / tshark — packet captures
- mitmproxy — inspect HTTP(S) traffic where appropriate (with consent on test sites)
- Puppeteer or Playwright — automated browser privacy checks (WebRTC, JS)
- prometheus + node_exporter + grafana — system and metric collection
- jq, csvkit — processing JSON/CSV outputs
Step-by-step lab build
1. Provision nodes and baseline them
On each node, install the same OS image (Ubuntu LTS recommended for consistency), update, and install required packages. Example for Ubuntu nodes:
sudo apt update && sudo apt upgrade -y
sudo apt install -y iperf3 curl wget tcpdump tshark chrony docker.io
Enable and start chrony to keep clocks in sync:
sudo systemctl enable --now chrony
2. Configure deterministic network settings
Set a fixed MTU on the physical interface and the VPN interface. Example for WireGuard:
ip link set dev eth0 mtu 1500
ip link add dev wg0 type wireguard
wg setconf wg0 wg0.conf
ip link set up dev wg0
ip link set dev wg0 mtu 1420
Document these settings and include them in automation so every run uses identical MTU values.
3. Deploy measurement server and collectors
On the server node:
- Run iperf3 server:
iperf3 -s -D - Start node_exporter for Prometheus metrics.
- Configure packet capture rotation: tcpdump with file size rotation using cron or systemd timers.
4. Automate test sequences
Create a controller script (bash/Python) that performs the sequence:
- Set VPN config (WireGuard/OpenVPN) and bring up tunnel.
- Wait for tunnel readiness, check route table and resolvability.
- Run iperf3 tests with varying stream counts and durations.
- Run latency tests (ping, hping3), and HTTP/QUIC requests with curl.
- Run privacy checks using a headless browser script.
- Collect logs, pcaps and push them to S3.
Example iperf3 invocation from client to server:
iperf3 -c
5. Automate privacy checks
Use Puppeteer (Node.js) to run a headless Chromium instance through the VPN and evaluate:
- Public IP seen by web services (GET https://httpbin.org/ip)
- DNS servers used (run a small page that triggers javascript to fetch STUN results or check via browser APIs)
- WebRTC candidate discovery (collect local and STUN candidate IPs)
- TLS client fingerprint — capture with tshark to analyze TLS ClientHello
Basic Puppeteer snippet to fetch a public IP:
const puppeteer = require('puppeteer');
(async () => {
  const browser = await puppeteer.launch({args:['--no-sandbox','--disable-setuid-sandbox']});
  const page = await browser.newPage();
  await page.goto('https://httpbin.org/ip', {waitUntil:'networkidle2'});
  const body = await page.evaluate(() => document.body.innerText);
  console.log(body);
  await browser.close();
})();
Privacy checks: concrete tests
Run these for each VPN configuration and record results:
- DNS leak: query a unique subdomain and verify the resolver that sees the query (capture on server and client).
- WebRTC leak: use STUN server (e.g., stun.l.google.com:19302) and record candidate IPs.
- IPv6 leak: ensure IPv6 is either routed through the VPN or disabled consistently.
- TLS fingerprint drift: capture TLS ClientHello to check if browser or middleboxes alter fingerprinting data.
Ensuring statistical validity
Run each test at least 5–10 times across different times of day and compute mean, median and 95% confidence interval. Record environmental variables as metadata: client CPU throttling, server load, cloud instance type, local ISP.
Example results pipeline
- Controller triggers tests and stores JSON outputs and pcaps in S3 under timestamped folders.
- A simple ETL job (Python) parses iperf3 JSON and aggregates throughput by region and transport.
- Prometheus/Grafana dashboards visualize CPU and network metrics during each run; Grafana snapshots archived.
- PCAPs processed with tshark to extract DNS queries, STUN packets, and TLS handshakes; results exported to CSV.
Common pitfalls and how to avoid them
- Background traffic on client: stop package managers, cloud-agent syncs, and auto-updates during tests.
- DNS caching: flush resolver caches between runs (systemd-resolved:
resolvectl flush-caches). - Low DNS TTL mismatch: when testing DNS leaks rely on capturing queries at both client and upstream to avoid false negatives.
- Clock skew: ensure chrony is running; timestamp drift breaks correlation of pcap events.
- Using consumer speed tests as sole benchmark: supplement with iperf3 and application-level checks (rclone, HTTP/QUIC downloads).
Case study: WireGuard vs OpenVPN (example matrix)
Run the same matrix across three server locations and both transports:
- Throughput: iperf3 -c -P 8 -t 30
- Latency: ping and curl to a fixed origin (use host with known low latency)
- CPU usage: observe during peak throughput
- Privacy: DNS and WebRTC tests
Store results and compare: WireGuard may show lower CPU and higher UDP throughput; OpenVPN over TCP might be more tolerant on restrictive networks. Document where each transport fails privacy tests (e.g., DNS leaks when split-tunneling misconfigured).
Automating repeat runs and CI integration
Integrate tests into CI (GitHub Actions, GitLab CI, or a self-hosted runner) to execute nightly runs and alert on regressions (e.g., average throughput drops > 15% or any DNS leak). Keep raw pcaps and derived artifacts for forensic replay.
Reporting and transparency
Publish reproducible test recipes: include the exact commands, OS image hashes, and test artifacts. Use signed manifests for results and provide scripts to re-run experiments. This level of transparency builds trust with your audience and helps others validate your findings.
Next steps and extensions
- Add multi-client concurrency tests to emulate real user loads (many clients per exit).
- Introduce middleboxes (NAT, DPI) in the path to measure resilience.
- Automate long-haul stability tests (24–72 hour runs) to capture intermittent failures.
- Incorporate application-level tests (video streaming, gaming) with synthetic workloads.
With consistent tooling, careful isolation and automated pipelines, you can produce VPN speed and privacy measurements that are both trustworthy and reproducible. Share your scripts and datasets so the VPN community can validate and improve on your methodology — and remember, reproducibility is as much about documentation and metadata as it is about raw numbers.